
The Wheel Strategy can generate 8-12% annualized returns with a conservative approach, 12-20% with a moderate approach, and 20-35%+ with an aggressive implementation.
These ranges assume premiums are reinvested and compounded over time.
No strategy guarantees returns, and The Wheel is no exception.
But keep in mind, your raw return is less important than the return you can generate consistently, across market conditions, without blowing up your account.
Inside this guide, I break down:
- What drives returns at each tier
- What drags them down
- What separates the traders who hit these numbers from the ones who don’t
If you’re new to The Wheel, start with What is The Wheel Strategy? and The Wheel Strategy: Step-by-Step for the full mechanics.
Let’s get started.
Table Of Contents
No Investment Comes With Guaranteed Returns

No investment is truly risk-free, including The Wheel Strategy.
At the time of this writing, the US Treasury 10-year note yields roughly 4.05%. That’s often called the “risk-free” rate, but even Treasuries carry inflation risk, interest rate risk, and policy/fiscal risk.
I don’t mean to turn this into a lesson on bond risk. But I share it to make a point: if even the “safest” investment on earth has risk baked in, expect The Wheel to carry risk too.
Lower risk, lower returns. Higher risk, higher potential returns.
With that understanding, let’s look at what The Wheel can realistically generate across three risk profiles.
Wheel Strategy Returns by Risk Profile
Below is a breakdown of expected returns and time investment per risk profile.
| Risk Profile | Expected Return | Drawdown Profile | Skill Required | Time Investment |
|---|---|---|---|---|
| Conservative | 8-12% annualized | Low-Moderate | Low-Medium | 1-2 hrs/week |
| Moderate | 12-20% annualized | Moderate | Medium-High | 3-5 hrs/week |
| Aggressive | 20-35%+ annualized | High | Very High | Daily |
Conservative: 8-12% Annualized
This is The Wheel at its most disciplined.
Assumptions
- High-quality value stocks, namely large and mega caps, and an occasional mid cap
- Selling Cash-Secured Puts (CSPs) at 20-25 delta (roughly a 75-80% probability the put expires worthless)
- No leverage or margin
- Sitting out earnings announcements and major binary events (Fed decisions, etc.)
- Willing to stay in cash if quality setups aren’t available or Implied Volatility (IV) is unattractive
Return Drivers
Primarily theta decay on CSPs with minimal directional exposure.
Character
Lower drawdowns, lower assignment frequency.
Boring, but in a good way.
This tier won’t make your heart race. It won’t impress anyone at a cocktail party either.
But it grinds out returns with the kind of consistency that compounds quietly over years.
Time Investment
1-2 hours per week, including weekly screening, monitoring existing positions, minimal adjustments.
Moderate: 12-20% Annualized
This is where most skilled Wheel practitioners realistically land.
Assumptions
- Mix of large and mid-cap stocks with healthy liquidity
- Mostly value stocks, but an occasional growth name when the setup is right
- CSPs and Covered Calls (CCs) sold at 25-35 delta — more premium collected, but also higher risk of assignment or getting called away
- Opportunistic exposure to elevated IV
- Selective earnings participation (only when a genuine edge exists)
- Rolling positions when tested, not panicking
Return Drivers
A combination of theta decay and modest directional bias.
“Directional bias” means you’re implicitly bullish on the stocks you’re selling puts on.
You benefit when they go up or stay flat, and you’re hurt when they drop significantly.
You’re also capturing the IV risk premium more consistently at this tier.
Character
Meaningfully outperforms buy-and-hold in sideways markets, but requires judgment, position sizing, and emotional control.
This is the aspirational tier for most Wheel traders (and for good reason).
It’s attainable. But it’s earned, not given.
Time Investment
3-5 hours per week — more active screening and research, rolling positions when tested, managing assignments and CCs.
Aggressive: 20-35%+ Annualized
Things start to get tough here.
Assumptions
- Smaller-cap or high-beta names
- High-growth stocks start creeping in (and yes, sometimes meme stocks)
- 40+ delta on CSPs and CCs
- Frequent earnings exposure
- Heavy IV harvesting
- Possible use of margin (carefully…or not)
- High turnover
Return Drivers
Elevated premiums plus directional tailwinds.
Character
Can compound fast in good years. But drawdowns can be sharp and psychologically taxing.
One bad ticker can dominate your entire P&L.
Time Investment
Expect daily or near-daily monitoring.
High turnover means constant decision-making, earnings plays require real-time attention, and position management becomes a part-time job.
You might want to have antacids set to auto-ship on your Amazon account.
Use The S&P 500 Is Your Benchmark
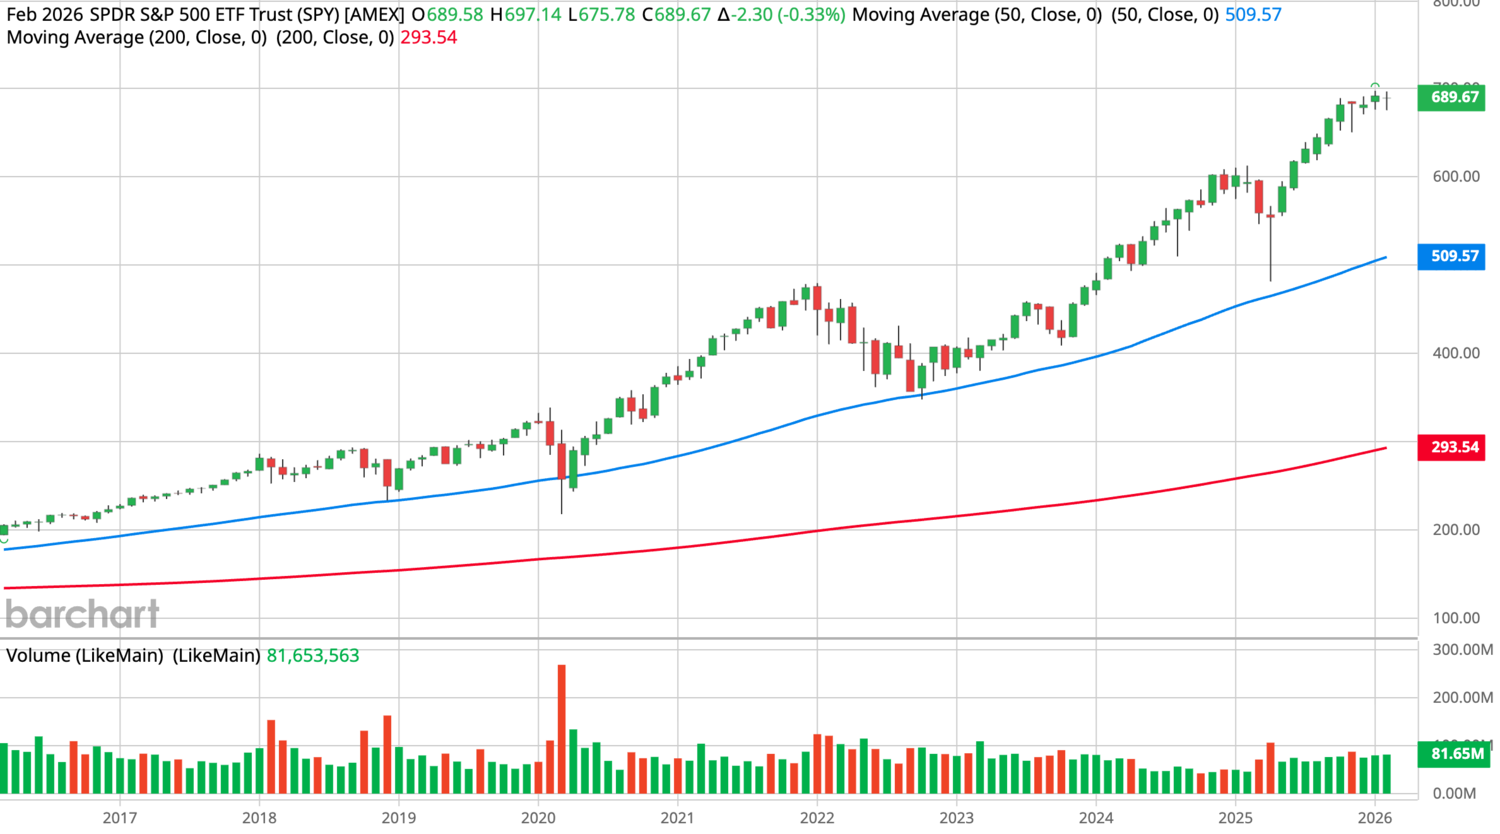
The S&P 500 has historically returned roughly 10% annualized over the long term.
That’s the return you could get by doing nothing except buying and holding an index fund like SPY.
Could you just buy SPY and call it a day? Absolutely.
And, in fact, that’s how many passive funds work.
They do the research to identify the best indexes, then invest in those. Index funds, by definition, have less volatility.
However, by choosing individual stocks you can beat index funds and the S&P 500. You just need to do so intelligently.
The Wheel’s goal is to beat the S&P 500 in one of two ways:
- Higher absolute returns (moderate and aggressive tiers can achieve this)
- Lower drawdowns and better risk-adjusted returns (conservative tier targets this)
Ideally, both.
If you can’t consistently achieve at least one of these over time, you’re better off going passive.
No shame in that — passive investing beats most active managers.
But The Wheel, done correctly, can outperform.
The Reality Check Most Traders Skip
The Wheel Strategy returns are highly sensitive to:
- Underlying stock selection
- Delta discipline
- Volatility regime
- Broad market performance (bull vs. bear vs. sideways)
- Assignment management
- Emotional decision-making
And here’s the thing most people won’t tell you:
Many traders think they’re running the moderate version. Most accidentally drift into the aggressive one during bull markets.
The root cause? Most people don’t bother to analyze options delta and IV vs. Historical Volatility (HV).
They just pick stocks that maximize premium.
Works great during bull markets. Catastrophic during downturns.
Better stock selection, proper screening, and disciplined analysis of your option contracts — that’s what separates a skilled Wheel practitioner from someone who’s just chasing yield.
How Taxes Affect Your Wheel Strategy Returns

Options held less than one year are taxed as short-term capital gains (i.e., meaning they’re taxed at your ordinary income rate).
Depending on your bracket, that could be 22%, 32%, or 37%+.
This is a meaningful haircut:
- A 15% pre-tax return might be 10-11% after taxes
- A 10% pre-tax return might be 7-8% after taxes
Compare that to long-term capital gains rates of 15-20% for buy-and-hold investors who hold positions for over a year.
The good news? Tax-advantaged accounts (IRA, Roth IRA) eliminate this drag entirely.
The Wheel Strategy is particularly powerful in these accounts.
Don’t calculate your returns before Uncle Sam takes his cut. Factor in taxes from day one.
What a Bad Year Looks Like for Each Tier
This is the part of the article where I stop being encouraging and start being honest.
Let’s frame this around a 2022-style bear market:
- Conservative: 10-15% drawdown. Still collecting premium, but assigned positions drag performance. Recovery is manageable due to quality stock selection.
- Moderate: 15-25% drawdown. Multiple assignments, some positions deeply underwater. Requires discipline to keep selling CCs and not panic sell.
- Aggressive: 30-50%+ drawdowns. High-beta and growth stocks get crushed, one or two bad tickers can devastate the portfolio. This is where accounts blow up.
In a 2008-style crash, all tiers suffer significantly.
But conservative and moderate practitioners recover faster due to the quality of their underlying holdings.
Aggressive practitioners may never recover if they panic sell at the bottom.
How Assignment Drag Eats Into Returns
When you get assigned, your capital transforms from cash into shares.
If that stock drops 30%, your “returns” for that position are deeply negative.
And here’s the problem:
The premium you collected doesn’t offset a cratering stock.
Let’s say you collected $200 in premium on a CSP. You get assigned, and the stock proceeds to drop $3,000 in value.
Net result: -$2,800.
That $200 in premium suddenly feels like a rounding error.
This is why stock selection matters so much.
If you’re assigned on a quality company, you can hold and sell CCs to recover over time. If you’re assigned on a garbage stock, you may have to cut your losses and move on.
Assignment isn’t the enemy — getting assigned on bad stocks is the enemy.
The Role of Compounding in Wheel Strategy Returns

The Wheel is not a single-trade strategy.
Instead, it’s a portfolio process where each cycle’s premium feeds the next round of capital deployment.
Premiums reinvested into new positions create a compounding effect over time.
That’s the mechanism that turns modest monthly returns into meaningful annual performance.
And compounding works both ways.
Consistent execution amplifies returns. Poor discipline amplifies losses.
The math is straightforward, but the discipline to let compounding do its work? That’s the hard part.
Time Investment vs. Returns — What Each Tier Actually Costs You
The Wheel Strategy is not passive. It requires ongoing management.
Here’s what that actually looks like:
- Conservative (1-2 hours/week): Weekly screening for new positions, monitoring existing ones, minimal adjustments needed
- Moderate (3-5 hours/week): More active screening and research, rolling positions when tested, managing assignments and CCs
- Aggressive (daily monitoring): High turnover means constant decision-making, earnings plays require real-time attention, position management becomes a part-time job
The more advanced you become, the better your stock and options screeners need to be.
Manual screening doesn’t scale.
Quality screeners help you find opportunities faster and filter out the noise — and the difference between good and bad screening compounds over hundreds of trades.
What Realistic Wheel Strategy Returns Look Like
| Risk Profile | Expected Return | Delta Range | Typical Stocks | Bad Year Drawdown | Time Investment |
|---|---|---|---|---|---|
| Conservative | 8-12% | 20-25 | Large/mega-cap value | 10-15% | 1-2 hrs/week |
| Moderate | 12-20% | 25-35 | Large + mid-cap mix | 15-25% | 3-5 hrs/week |
| Aggressive | 20-35%+ | 40+ | Small-cap, high-beta | 30-50%+ | Daily |
Returns depend on your tier, your discipline, your stock selection, and market conditions.
The Wheel Strategy isn’t a magic money machine.
It’s a structured process that, executed with discipline, can meaningfully outperform passive investing.
The question isn’t whether The Wheel can generate these returns…
It’s whether you can stick to the rules long enough to realize them.
- If you’re just getting started, What is The Wheel Strategy? covers the full mechanics
- The Wheel Strategy: Step-by-Step walks through a real trade from entry to exit
- And How Much Capital Do You Need for The Wheel Strategy? breaks down what’s possible at each account size
Disclaimer
WheelMetrics is an educational resource, not financial advice. WheelMetrics is not a registered investment advisor, broker-dealer, or financial planner. Everything here, including articles, newsletters, stock screening results, options setups, market commentary, is for educational and informational purposes only. Options trading carries substantial risk, and you can lose some or all of your capital. You're solely responsible for your own investment decisions. Consult with a qualified financial advisor before making any trades.