 by

The juiciest premiums in the market tend to sit on the worst businesses.
That’s not bad luck. Premium is payment for risk, and the market is usually right about where the risk lives.
So before you sell a put, you need a way to check whether there’s a real business behind the premium.
Three metrics do that job:
- Return on invested capital (ROIC)
- Net profit margin
- Free-cash-flow-to-net-income
ROIC tells you whether the business creates value. Margin tells you whether it keeps what it makes. Free-cash-flow-to-net-income tells you whether the profits are real.
Together, they separate the compounders you’d be happy to own from the value traps dressed up in fat IV.
Remember, when running the Wheel Strategy, quality companies are essential. Every cash secured put you sell is a standing offer to buy 100 shares on assignment of the company behind it.
Table Of Contents
Why Profitability Is the Quality Test
In my stock selection framework, profitability is the second of four pillars:
- Valuation
- Profitability (you are here)
- Growth
- Upward Revisions/Forward Guidance
Valuation told you whether the price is right. Profitability tells you whether the business is any good.
You need both. A cheap business that doesn’t create value is a value trap, not a bargain.
The core rule of the Wheel is to only sell puts on stocks you’d genuinely want to own. Profitability metrics are how you make “want to own” operational; they turn a feeling into evidence.
I work through profitability as three questions:
- Does it earn a high return on the capital it uses? (ROIC)
- How much of each sale does it actually keep? (margins)
- Are the profits real, or just on paper? (free-cash-flow-to-net-income)
Each question has a metric behind it, and each metric has a bar I want it to clear.
Question 1: Does It Earn a High Return on the Capital It Uses?

ROIC (return on invested capital) answers a blunt question:
For every dollar the business has put to work (debt and equity combined) how many cents of profit does it earn back each year?
ROIC is the single most important profitability number, because it measures whether the business creates value above its cost of capital.
- A high-ROIC business compounds. Every dollar it reinvests earns back more than that dollar cost to raise.
- A low-ROIC business runs in place no matter how big it gets. It can grow revenue for a decade and create nothing.
The S&P 500’s long-run average annual return is roughly 10%, so the widely used quality bar is ROIC of about 15% or higher. This standard also happens to be where I draw my own line.
If a business can’t comfortably out-earn the index’s own long-run return on the capital it employs, why take single-stock risk on it? You could just buy the index and skip the assignment risk entirely.
A Quick Note on ROE
You’ll often see ROE (return on equity) quoted instead. It’s the more famous cousin.
The problem is that ROE is gameable. A company can load up on debt, shrink its equity base, and watch ROE climb while the underlying business gets no better.
ROIC puts debt in the denominator, so leverage can’t fake it.
That matters on the Wheel (or any other long-term investment). You don’t want to get assigned on a business whose “quality” was really just borrowed money.
When a put goes in the money and you take the shares, you might hold them for weeks or months while you grind covered calls.
A high ROIC means the business is compounding while you wait. A low ROIC means it’s decaying underneath you.
Example ROICs
Let’s walk through the following table of example ROIC values:
| Ticker | ROIC |
|---|---|
CLS | 35% |
SNDK | 33% |
MU | 29% |
CRDO | 18% |
AIR | 9% |
Note: The five tickers below surfaced in the weekly quality screen I run for my own portfolio and for WheelMetrics Pro. None of these values are “secret”. ROIC, margins, and cash flow all come straight from company filings, and any decent data provider will hand them to you. Treat the figures as a snapshot from the week I ran the screen. They’ll have drifted by the time you read this. But how to read them is what this article is about.
CLS and SNDK, in the mid-30s, are elite.
MU at 29% is strong.
CRDO at 18% clears the ~15% bar without being extreme. That’s alright because clearing it is all you need.
AIR at 9% fails it. That’s a business earning less on its own capital than the index returns on autopilot. Exactly what a weak return profile looks like.
Question 2: How Much of Each Sale Does It Actually Keep?

Net profit margin is net income divided by revenue: of every dollar the company brings in, how much it actually keeps after everything — costs, overhead, interest, tax.
The rule of thumb is double digits. A net margin of roughly 10% or better says the business has room to absorb a bad quarter and still make money.
Sub-10% margins usually signal commodity exposure, brutal competition, or an inefficient operation. All three are bad things to be assigned on.
Additionally, it may be helpful to read net margin within context of both gross margin and operating margin:
- Gross margin: Revenue minus the direct cost of the product; this is where pricing power shows up
- Operating margin: What’s left after the cost of actually running the business; this is efficiency
- Net margin: What survives interest and taxes; the bottom line
Reading all three tells you where the money goes and why. This is far more than the net number alone.
A business with fat gross margins and a thin net margin has an expense problem, which is fixable. A business with thin gross margins has a pricing problem, and no amount of cost-cutting fixes that.
Net Profit Margin Examples
Here’s the net profit margin for those same five companies:
| Ticker | Net Profit Margin |
|---|---|
MU | 41% |
SNDK | 34% |
CRDO | 32% |
CLS | 7% |
AIR | 6% |
Note how CLS topped the ROIC rankings at 35%. Here it sits at 7%, well under the double-digit bar.
Is it suddenly a bad business? No. Celestica is a contract manufacturer: it turns its capital over fast and earns a thin slice on enormous volume. The thin margin is structural, the same way a grocery store’s is.
A single metric below the bar isn’t a disqualification. You read the pattern across metrics and ask why before you judge.
For the names that do carry wide margins, durability is the point. Durable margins mean pricing power, and pricing power is what holds a stock up if you’re assigned and have to ride out a rough patch.
Notice how MU, SNDK, and CRDO all boast double-digit net profit margins while AIR, similar to the ROIC example, rounds at the bottom.
Question 3: Are the Profits Real, or Just on Paper?

Free-cash-flow-to-net-income is exactly what it sounds like: free cash flow divided by net income. It’s the quality-of-earnings check. Does the profit on the income statement actually show up as cash?
Recall that net income is an accounting figure. It covers accruals, depreciation timing, revenue-recognition choices, and all of it bends the reported number.
Net income is an opinion. Cash in the bank is a fact.
Free cash flow, which is the cash left after the business funds its own operations and investments, is much harder to dress up.
The rule of thumb: about 80% or more of net income should convert to free cash flow. Below that, you start asking hard questions.
But a low ratio has two very different causes, and you need to know which one you’re looking at:
- Accounting games: The reported profit isn’t really there, and earnings quality is quietly deteriorating
- Heavy reinvestment: Real cash is going into the business’s future (plants, capacity, R&D), not evaporating
The first is a reason to walk away. The second is often fine, and sometimes exactly what you want to see.
FCF-to-Net-Income Examples
Now let’s examine FCF-to-Net-Income values:
| Ticker | FCF-to-Net-Income |
|---|---|
SNDK | 99% |
CRDO | 84% |
CLS | 51% |
MU | 43% |
AIR | 22% |
Let’s take a look at MU, which, so far, has been an example of an elite stock for both ROIC (29%) and net profit margins (41%).
However, only 43% of net income is converting into cash…well below the 80% rule of thumb.
Why? Micron is a capital-intensive semiconductor business pouring cash into fabs during the memory upcycle. That’s reinvestment, not manipulation. But you only know it because you asked why the number was low.
For a Wheel trader, the cash question is survival math. A genuinely cash-generative business cruises through the months you might hold it after assignment.
A business that reports profits but burns cash can be forced into dilution or a dividend cut at exactly the moment you’re stuck holding the shares.
Detecting the Compounder vs. the Value Trap
| Ticker | ROIC | Net Profit Margin | FCF-to-Net-Income |
|---|---|---|---|
SNDK | 33% | 34% | 99% |
CRDO | 18% | 32% | 84% |
MU | 29% | 41% | 43% |
CLS | 35% | 7% | 51% |
AIR | 9% | 6% | 22% |
Let’s dissect each of these companies in terms of ROIC, net profit margins, and FCF-to-Net-Income:
SNDK: Strong on all three; the compounder profile (with one big caveat coming in the next section)CRDO: Clears every bar without a single extreme; you don’t need elite, you simply need to clear itMU: Two elite numbers and a low cash conversion you can explain (fab capex); very much own-ableCLS: Elite returns on capital with structurally thin margins; fine once you understand the business modelAIR: Weak on all three; this is the stock you pass on
Stocks that are strong across the board are businesses you’d be happy to get assigned on.
Strong on two with one explainable miss demands that you understand the why. MU and CLS both show what a good “why” looks like.
Weak on all three is the real tell. One miss is a question; three misses are an answer, and that answer is “Move along”.
And this is where the valuation pillar connects. Valuation can tell you a stock is cheap. Only profitability tells you whether the business behind the cheap price is real.
A cheap stock with weak profitability is a value trap, not a bargain.
That’s the failure behind plenty of beaten-down “value” names and most meme-stock premium. And whichever side of the value vs. growth spectrum a stock sits on, these three metrics still apply.
Growth Is Not Enough
Every metric covered in this article measures the business itself. None of it measures where the stock price is in its run.
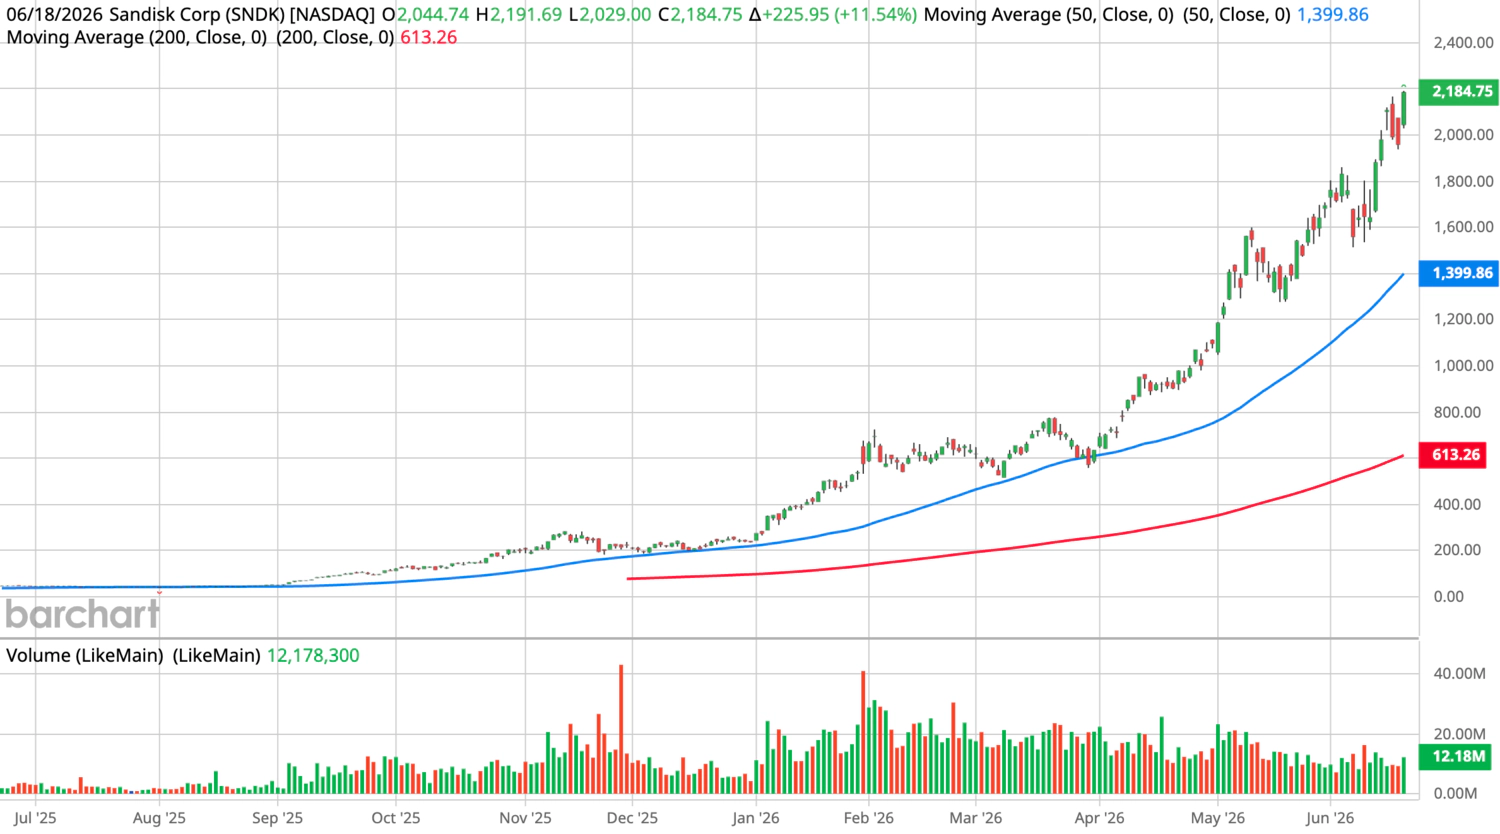
SNDK is an example of a stock that passes all the profitability thresholds, but is a warning…and you wouldn’t know that until you looked at the price chart.
This stock has appreciated roughly 4,000% over the trailing year!
Naturally, the stock that screens the best is exactly the one you’ll be most tempted to chase.
When a parabolic move rolls over, it rolls over hard. And a strike that looked like a discount on the way up can sit far above where the stock settles once it gives back gains.
If you sell a cash secured put on a vertical chart, you may get assigned into a falling knife, with a fat premium as your only consolation. That’s the high-flier trap in its purest form.
Strong business growth is not the same as a good entry price.
- Profitability tells you the company is worth owning.
- The chart tells you whether you’re stepping in at a sane point or chasing a vertical move.
- Too much of a good thing, like growth that’s already fully priced and then some — turns into risk.
You need to weigh profitability, valuation, growth, and the chart together, and sometimes the right call on a great company is to wait for a better entry, or pass entirely.
Quality Is What You’re Left Holding
Valuation answers one question: is the price right?
Profitability answers the one underneath it: is the business worth owning?
On the Wheel, where assignment can leave you holding a stock for months, the second question is the one that protects you. Premium is what you’re paid up front. The business is what you’re left holding. So make sure it’s one that creates value while you hold it.
Checking ROIC, margins, and cash conversion on one stock takes twenty minutes and can be accomplished using a free tool, such as Yahoo Finance, or a paid app, like TradingView.
Premium pays you. Quality is what keeps you.