 by
by 
This is the complete options fundamentals resource for Wheel traders. Options are the engine behind The Wheel Strategy, and most traders start running that engine without reading the manual.
The cost of skipping these fundamentals isn’t theoretical. It shows up in your account as blown trades, unnecessary losses, and positions you don’t understand.
Every concept in this guide exists because ignoring it costs real money:
- Contracts
- The Greeks
- Volatility
- Liquidity
- Common mistakes
Each one is a lesson the market will teach you eventually.
The only question is whether you pay for the education with time or with capital (or both).
Table Of Contents
What Are Stock Options and Why They Matter for The Wheel
An option is a contract that gives the holder the right (but not the obligation) to buy or sell 100 shares of a stock at a specific price by a specific date.
That’s it.
Not a share of stock.
Not an ownership stake.
A contract.
Each contract controls 100 shares. That multiplier is what makes options powerful (and also dangerous).
Options are derivatives, meaning their value is derived from the underlying stock they’re attached to.
Calls vs. Puts
There are two flavors of options:
- Call option: Gives the holder the right to buy shares at the strike price by the expiration date
- Put option: Gives the holder the right to sell shares at the strike price by the expiration date
For Wheel traders, the distinction matters because you’re primarily selling these contracts. You sell puts during the CSP phase and sell calls during the CC phase.
In The Wheel Strategy, you are the seller, not the buyer, of options.
The Buyer vs. Seller Asymmetry
Buyers pay premium for the right to do something.
Sellers collect premium for accepting the obligation to do something.
The risk profiles are asymmetric:
- Buyers: Limited risk (the premium they paid), theoretically unlimited upside
- Sellers: Limited upside (the premium collected), significant downside exposure
This asymmetry is why premium exists. Sellers are compensated for taking on risk.
It’s not free money — it’s compensation for an obligation.
For The Wheel, you are always the seller, collecting premium in exchange for obligations you’re prepared to fulfill (buying shares you want to own, selling shares at target prices).
Could you lose money? Absolutely.
But you enter every trade knowing exactly what your obligation is and being genuinely willing to fulfill it.
Why Options Exist
Options serve four primary purposes:
- Leverage: Control 100 shares for a fraction of the cost of actually owning 100 shares outright
- Hedging: Insurance against portfolio losses
- Speculation: Directional bets with defined risk
- Income generation: Selling premium systematically
The Wheel lives squarely in category four.
You’re not speculating on direction.
You’re not buying lottery tickets.
You’re selling premium, systematically, on stocks you want to own anyway.
For the full beginner walkthrough with worked examples, see What Are Stock Options? A Beginner’s Guide.
Understanding Options Contracts: Strike Price, Expiration, and Premium
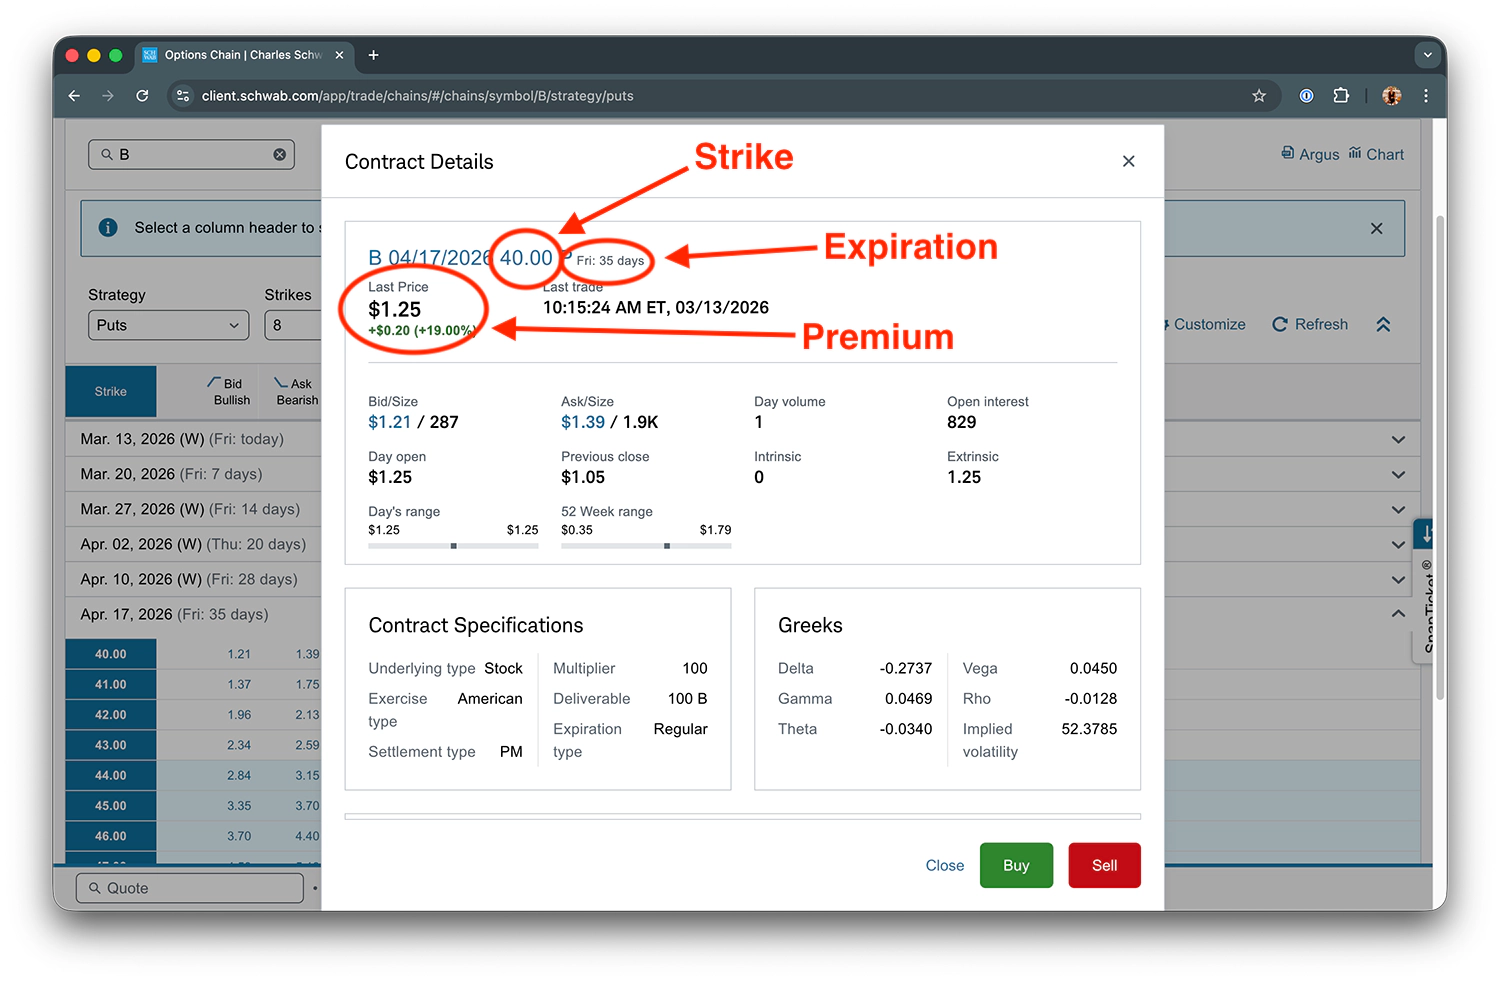
Every options contract has three core components:
- Strike price
- Expiration date
- Premium
These aren’t independent. They interact with each other (and with the underlying stock price) to determine the contract’s value.
Understanding how they work together is what separates informed traders from guessers.
Strike Price
The strike price is the price at which you agree to buy (for puts) or sell (for calls) shares if the option is exercised.
Strike selection is one of the most important decisions in The Wheel.
Where the strike sits relative to the current stock price determines your moneyness:
- ITM (in the money): Strike is favorable to the option holder (put strike above stock price, call strike below)
- ATM (at the money): Strike equals or is very close to the current stock price
- OTM (out of the money): Strike is unfavorable to the option holder (put strike below stock price, call strike above)
For Wheel CSPs, you typically sell OTM puts. The strike sits below the current price, giving the stock room to drop before you’d be assigned.
Expiration Date
Every option has a defined lifespan (i.e., it expires on a specific date).
DTE (days to expiration) is how traders measure time remaining.
You’ll see options categorized as weeklies, monthlies, or LEAPS (one year or longer), but for The Wheel you’ll mostly live in the monthlies range.
For The Wheel, 30-45 DTE is the sweet spot. It balances theta decay acceleration (where you earn the most daily income) with manageable gamma risk (where sudden moves are less likely to flip your position).
More on both of those when we get to the Greeks.
Premium
Premium is the price of the contract. It’s what you collect as a seller or pay as a buyer.
It breaks down into two components:
- Intrinsic value: The amount the option is ITM (OTM options have zero intrinsic value)
- Extrinsic value: Time value plus volatility value, which is what decays over time and what Wheel sellers primarily collect
Note: Premium is quoted per share, but each contract covers 100 shares. A $1.50 premium means $150 per contract.
How the Three Interact
These components don’t exist in isolation. The tradeoffs between them define every Wheel decision:
- Deeper OTM means lower premium but more room before assignment
- Longer DTE implies higher premium but slower initial decay
- ATM options have the highest extrinsic value (maximum uncertainty)
The Wheel trader’s job is balancing these tradeoffs based on risk tolerance and market outlook.
There’s no single “correct” answer, only the answer that fits your situation.
For the full breakdown with worked examples, see Understanding Options Contracts: Strike, Expiration, Premium.
How to Read an Options Chain
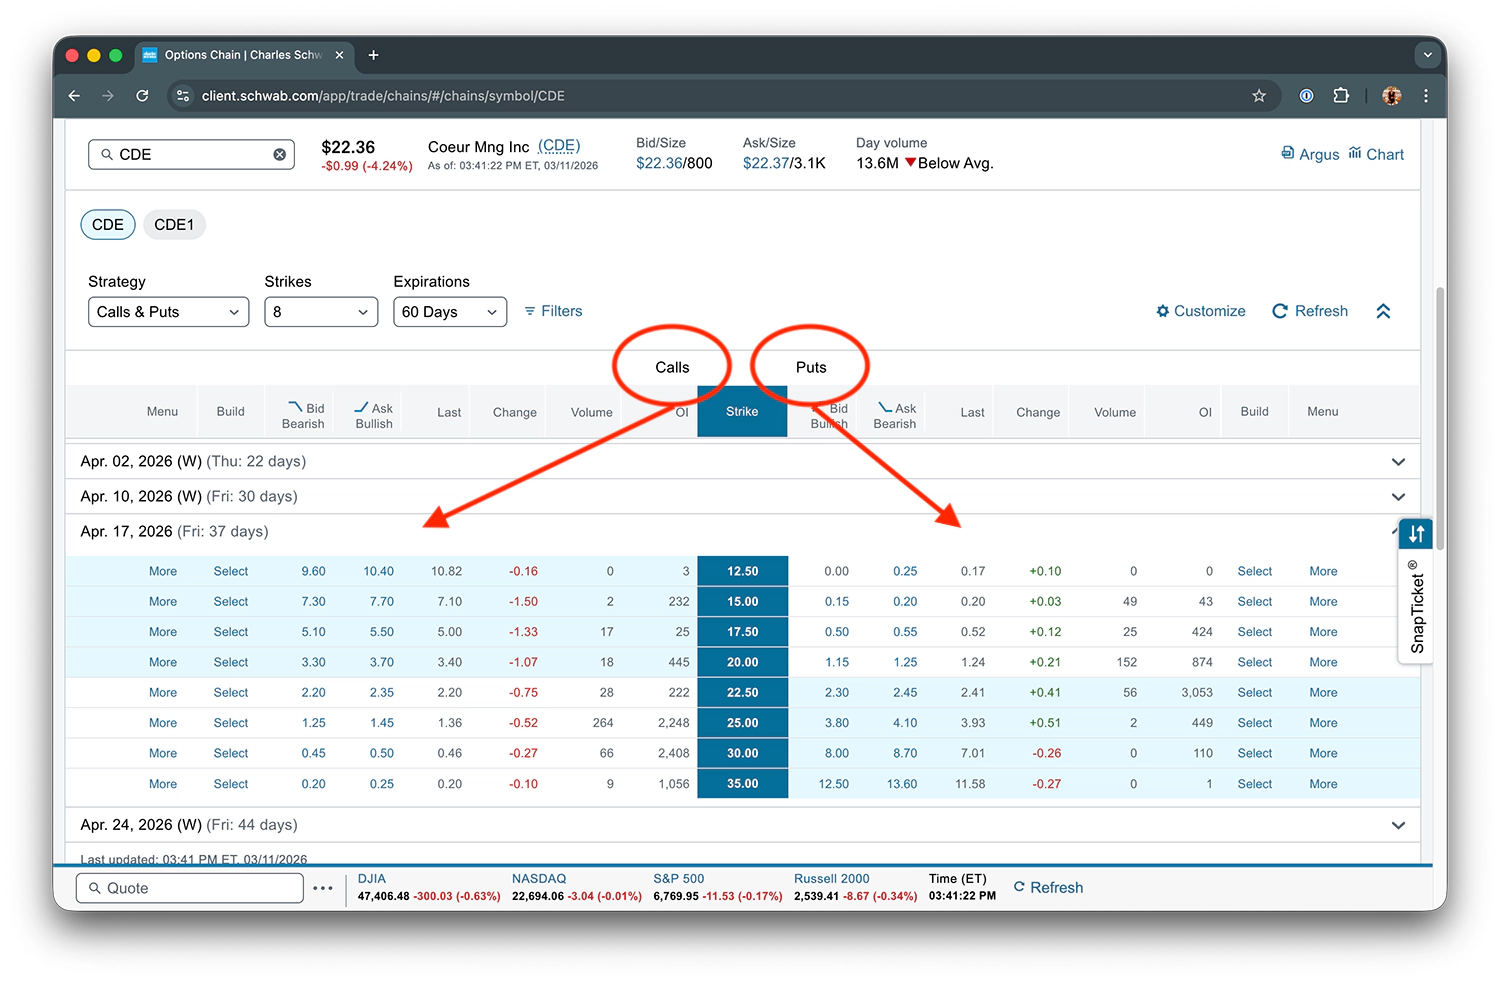
The options chain is the dashboard showing all available contracts for a given stock.
It’s where you find, evaluate, and select your trades.
Every broker displays an options chain.
Learning to read it is non-negotiable.
Layout
The standard structure is consistent across most brokers:
- Calls on the left, puts on the right, strike prices down the center column
- Each row represents one strike price
- Tabs or dropdowns let you select the expiration date
- The ATM strike is typically highlighted or centered
Key Columns
Here’s what each column tells you:
- Bid: What someone will pay you right now (the price you get when selling)
- Ask: What someone wants you to pay (the price you pay when buying)
- Last: The most recent trade price (can be stale, don’t rely on it for illiquid options)
- Volume: Number of contracts traded today (resets daily)
- Open Interest (OI): Total outstanding contracts (cumulative, carries day to day)
- Greeks columns: Delta, theta, gamma, vega, your risk metrics at a glance
Bid-Ask Spread as a Liquidity Check
The bid-ask spread is often the first thing experienced traders check.
A tight spread (under 3-5% of premium) means the option is liquid. You’ll get filled at a fair price.
A wide spread (20%+ of premium) means the option is illiquid. You’ll pay more to get in and more to get out.
This matters a lot more than most beginners realize. We’ll cover why in the liquidity section below.
Volume vs. Open Interest
These two columns measure different things:
- Volume is today’s activity (resets to zero each day)
- Open Interest is total outstanding positions (cumulative)
High OI means there’s established interest at that strike. High volume with low OI means new interest is building.
For Wheel trades, you want both to be reasonably healthy. Thin volume and low OI mean you’re trading in the dark.
For the complete walkthrough with annotated chain screenshots, see How to Read an Options Chain.
The Options Greeks: What Moves Your Position

The Greeks measure how your option’s price changes in response to different market variables.
Think of them as the instrument panel of your position. Each gauge tracks a different risk factor.
You don’t need a math degree, but you do need to understand what each one tells you and why it matters for your Wheel trades.
Delta: Price Sensitivity and Probability Proxy
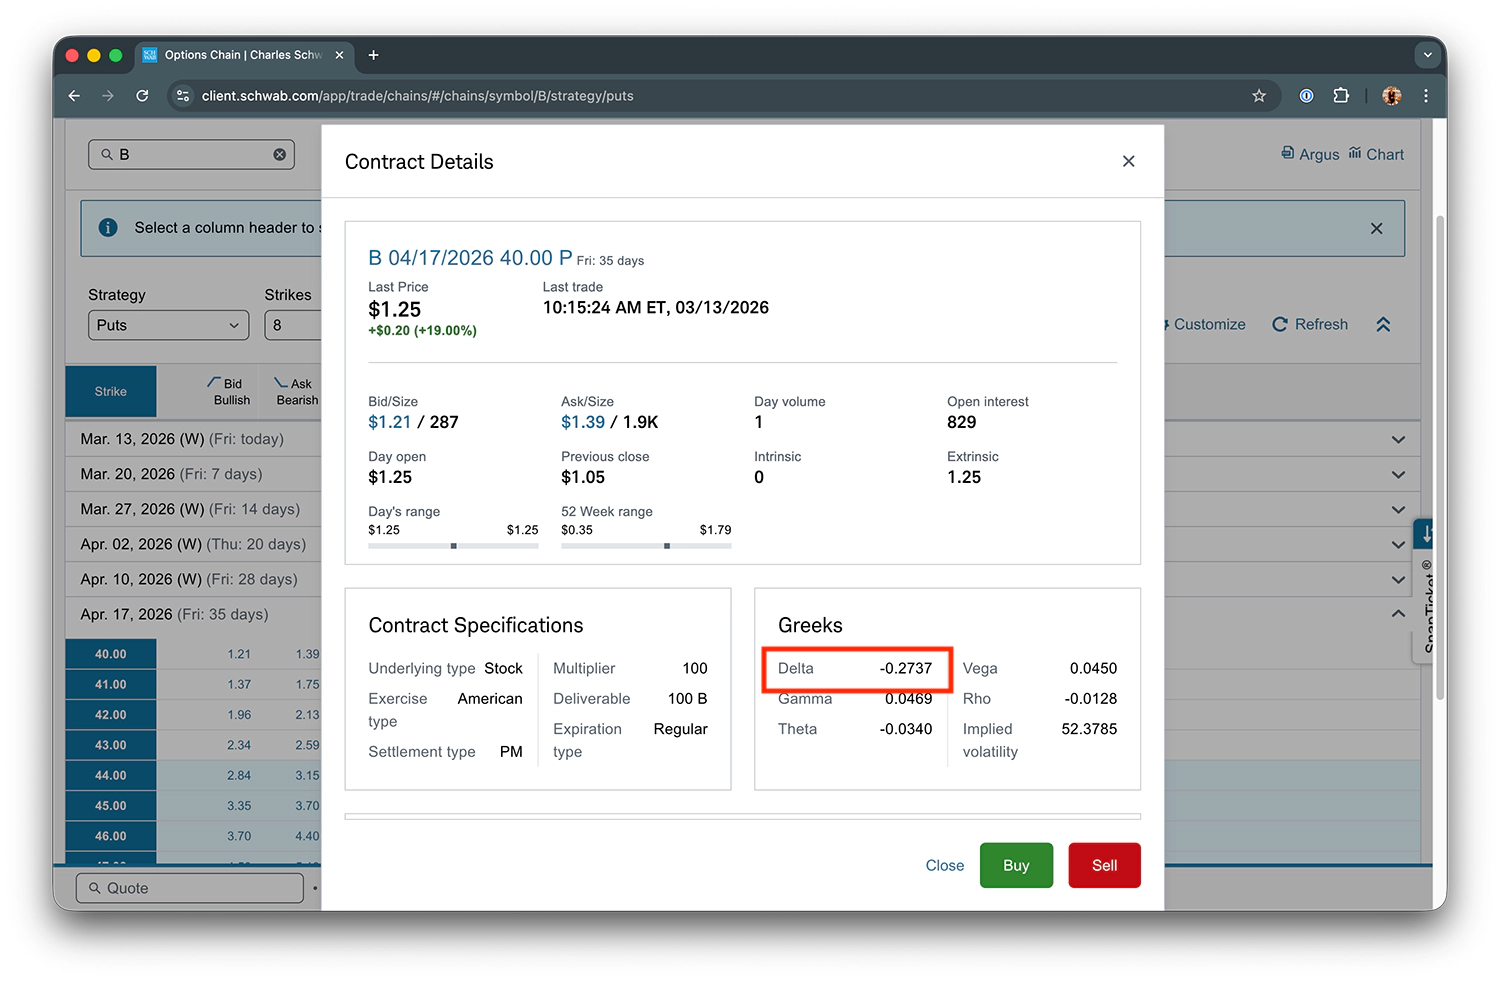
Delta measures how much the option’s price changes for a $1 move in the underlying stock.
It ranges from 0 to 1.0 for calls and 0 to -1.0 for puts (the absolute value is what matters for most decisions).
Here’s the mental model experienced traders use:
Delta roughly equals the probability the option expires ITM. A 0.30 delta put has roughly a 30% chance of expiring ITM, which means a 70% chance of expiring worthless.
Note: This is an approximation, not an exact calculation. But it’s the framework that drives most real-world strike selection decisions.
Here are common delta tiers for Wheel CSPs:
- Conservative: 0.20-0.25 delta (75-80% probability of expiring OTM)
- Moderate: 0.25-0.35 delta (65-75% probability)
- Aggressive: 0.40+ delta (higher premium, higher assignment risk)
For covered calls, the same concept works in reverse. Delta determines how likely your shares are to get called away.
Theta: The Income Engine
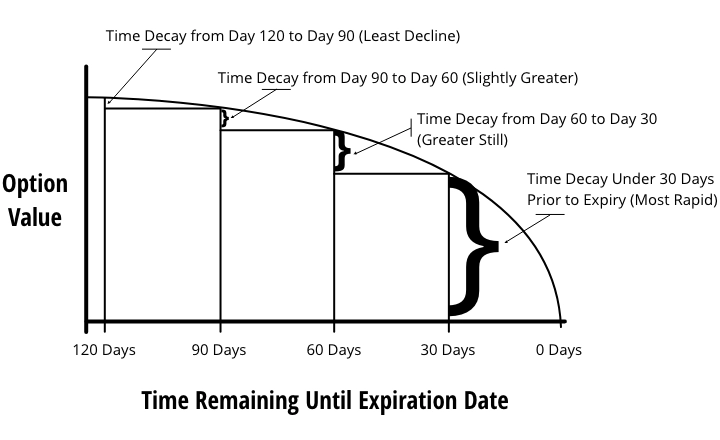
Theta measures how much value the option loses each day just from time passing.
For option holders (buyers), theta is always negative. Time works against them.
For option sellers (i.e., us), theta is always positive. This is the source of Wheel income.
The decay curve is non-linear. Think of it like a hockey stick:
- 60+ DTE: Slow, barely noticeable daily decay
- 30-45 DTE: Acceleration begins (the sweet spot for entering Wheel trades)
- Under 14 DTE: Aggressive decay, maximum daily income but also maximum gamma risk
- Final week: Dramatic acceleration
This is why 30-45 DTE is the sweet spot for The Wheel. You capture the acceleration phase of theta decay while avoiding the gamma risk that comes with the final two weeks.
One more thing:
ATM options have the highest theta. Maximum uncertainty means maximum time value…which means maximum decay working in your favor.
Gamma: Delta’s Rate of Change
Gamma measures how quickly delta changes as the stock price moves.
High gamma means your delta (and therefore your entire risk profile) can shift rapidly.
Gamma is highest for ATM options near expiration. This is precisely why the final week is dangerous for sellers. Your “safe” OTM put can quickly become ITM with a relatively small stock move.
Gamma risk is a key reason to avoid selling options with less than 7 DTE (unless you’re deliberately managing an existing position).
Vega: Volatility Sensitivity
Vega measures how much the option’s price changes for a 1% change in implied volatility.
High vega means the option price is very sensitive to IV changes.
The concept that matters most here is IV crush. When IV drops sharply (typically after earnings announcements or other catalysts), option prices can collapse even if the stock barely moves.
IV Crush works in favor for Wheel sellers. Sell when IV is elevated, collect premium, then let IV crush accelerate your profit.
Longer-dated options have higher vega, making them more sensitive to IV changes.
How All Four Work Simultaneously
These Greeks aren’t independent. They interact on every position you hold.
A Wheel CSP at 30 DTE on a stock with elevated IV has:
- Moderate delta risk
- Strong theta working in your favor
- Manageable gamma
- High vega exposure (which works for you if IV drops after you enter the trade)
Understanding the Greeks isn’t about memorizing formulas. It’s about knowing which forces are pushing and pulling on your position (and in what direction).
You don’t need to calculate them by hand. Your broker does that. You just need to know what the numbers mean when you see them on your options chain.
(And yes, that was a lot of dense material. If you’re still reading, congratulations…you now understand more about options risk than most traders who’ve been Wheeling for a year.)
- For the complete Greeks overview with worked examples, see The Options Greeks Explained
- For delta-based strike selection with real examples, see Understanding Delta
- For the complete decay curve analysis and DTE optimization, see Understanding Theta
Understanding Volatility: IV, HV, and the Gap Between Them

Volatility is the single most misunderstood concept in options trading.
Most beginners see “high IV” and think “more premium = better trade.”
That thinking will cost you money…and potentially lead to a blown account.
Implied Volatility (IV)
IV is forward-looking. It’s the market’s consensus estimate of how much a stock will move over a given period, expressed as an annualized percentage.
Higher IV means the market expects larger moves, which translates directly to higher option premiums.
The expected move formula makes this concrete:
- Expected Move = Stock Price x IV x sqrt(DTE / 365)
- A $50 stock with 40% IV over 30 DTE = $50 x 0.40 x sqrt(30/365) = ~$5.73
- This means the market expects the stock to stay within roughly +/- $5.73 about 68% of the time (one standard deviation)
IV is not a prediction of direction. It only tells you about expected magnitude. The stock could go up $5.73 or down $5.73. IV doesn’t care which.
IV Rank and IV Percentile
Raw IV alone is meaningless without context.
For example, is 40% IV high or low for NVDA?
What about APPL?
Or XOM?
That’s where IV Rank and IV Percentile come in:
- IV Rank: Where current IV falls within the 52-week range (0-100 scale). An IV Rank of 80 means current IV is near the top of its annual range.
- IV Percentile: What percentage of days in the past year had lower IV. An IV Percentile of 80 means IV was lower than today on 80% of trading days.
Both are useful. IV Rank gives you quick orientation. IV Percentile gives you a more complete picture.
Wheel traders generally want to sell when IV Rank/Percentile is elevated (above 30-50+, depending on your risk tolerance).
Elevated IV means elevated premium, which means you’re collecting more income for the same obligation.
But make sure you do your homework to determine exactly why IV is elevated!
The market may know more than you do (and likely does…)
Don’t take unnecessary risk.
Historical Volatility (HV)
HV is backward-looking. It measures how much the stock actually moved over a past period of time.
Common HV look-back windows include:
- 20-day (roughly one month of trading days)
- 60-day (three months)
- 252-day (one year)
Essentially:
- HV anchors your expectations in reality
- IV tells you what the market expects
- HV tells you what actually happened
When different HV windows diverge significantly (for example, 20-day HV is much higher than 60-day HV), it signals a regime shift.
Something changed recently, and the stock’s behavior has shifted.
The IV/HV Gap
| Quadrant | IV | HV | Gap | Verdict |
|---|---|---|---|---|
| The Sweet Spot | High | Low | IV » HV | Sell option (with due diligence) |
| Justified IV | High | High | IV ≈ HV | Cautious sell (be careful) |
| The Desert | Low | Low | IV ≈ HV | Wait, premiums too thin |
| The Trap | Low | High | IV « HV | Skip, you’re being underpaid |
The gap between IV (what the market expects) and HV (what actually happened) is one of your primary filters for Wheel trade quality.
- When IV > HV: The market is pricing in more movement than has actually occurred. You’re potentially getting a great deal by being overpaid to sell premium.
- When IV < HV: The market is pricing in less movement than has occurred. You may be undercompensated for the actual risk.
The four quadrants framework puts this into a decision matrix:
- Sweet Spot: High IV, Low HV — overpaid for a calm stock (ideal for The Wheel)
- Justified: High IV, High HV — high premium, but the stock is genuinely volatile (proceed with caution)
- Desert: Low IV, Low HV — low premium on a calm stock (poor Wheel candidates)
- Trap: Low IV, High HV — underpaid for a volatile stock (avoid)
The sweet spot is where IV meaningfully exceeds HV. You collect elevated premium on a stock that isn’t actually moving as much as the market fears.
Of course, that’s not a guarantee of profit. But it’s the closest thing to a structural edge that premium sellers get.
- For the complete IV breakdown including IV crush mechanics and the earnings debate, see What Is Implied Volatility (IV)?
- For multi-window HV analysis and regime shift detection, see What Is Historical Volatility (HV)?
- For the full four-quadrant analysis with real mining stock examples and the pre-trade volatility checklist, see IV and HV: Using Volatility to Select Better Wheel Trades
Bid-Ask Spreads and Why Liquidity Is Non-Negotiable
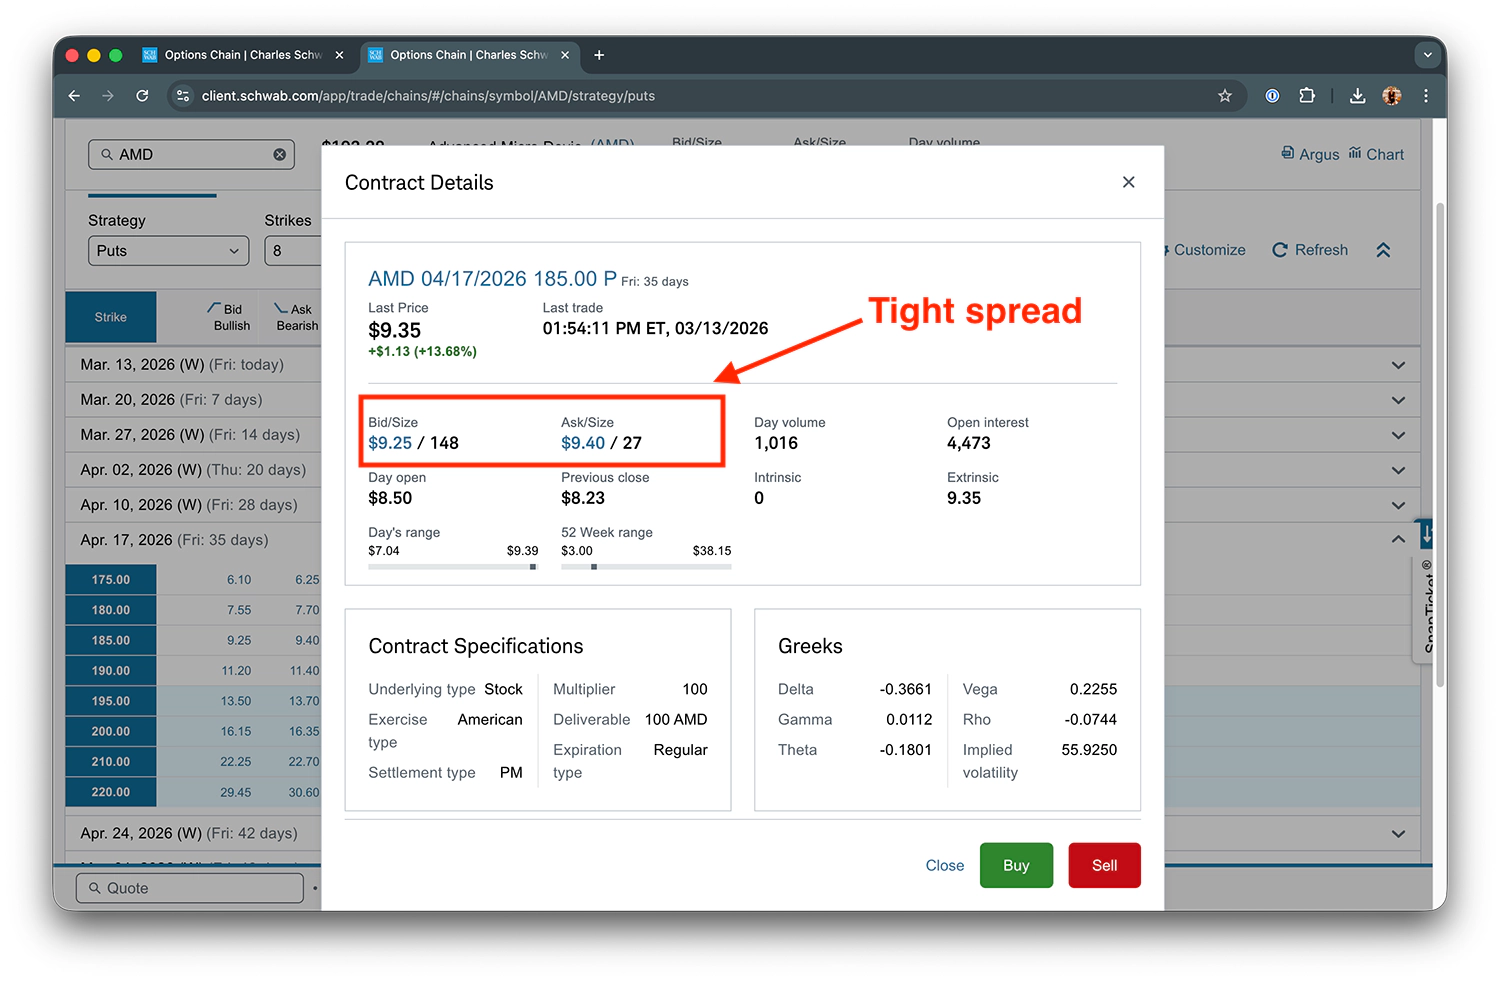
The bid is what someone will pay you. The ask is what you’d have to pay them.
The gap between them is the spread (the market maker’s compensation for providing liquidity). Every time you trade, you cross it.
It’s an invisible transaction cost that most beginners completely ignore.
Why Spread Width Matters for Wheel Traders
Wheel traders cycle through trades repeatedly. Across all positions, that’s 30-40+ round trips per year, potentially higher if you’re selling lower DTEs.
Each round trip crosses the spread twice (once to open, once to close or roll).
A $0.10 spread on a $2.00 option is 5% cost.
Multiply that by 30-40 cycles and it compounds into real money.
Spread as Percentage of Premium
Dollar spread alone is misleading. You need context.
Compare these two scenarios:
- $0.15 spread on a $5.00 premium = 3% (acceptable)
- $0.50 spread on a $1.00 premium = 50% (devastating)
Same mechanism. Wildly different impact.
Rule of thumb: target spreads under 5% of premium for Wheel trades. Under 3% is ideal.
What Drives Spread Width
Six factors determine how wide the spread will be:
- Stock’s overall options volume and popularity
- Specific strike’s volume and open interest
- Time to expiration (farther out tends to be wider)
- Market conditions (spreads widen during volatility spikes)
- Price of the underlying
- Number of market makers active in that name
You can’t control most of these. But you can choose to trade liquid names in the first place.
Always Trade at Mid or Better
Never hit the market price.
When selling, don’t just accept the bid.
When buying, don’t just pay the ask.
Always use limit orders. Start at ask price, wait 10-15 minutes, then adjust closer to the mid if you don’t get filled.
Patience on fills saves real money over a full year of Wheel trading. It’s the easiest optimization most traders never bother with.
Remember, death by a thousand cuts is still death.
For the complete liquidity analysis with side-by-side comparisons and compounding cost calculations, see Understanding Bid-Ask Spreads and Options Liquidity.
Common Mistakes That Cost Wheel Traders Real Money

Every concept in this guide exists because ignoring it leads to specific, predictable mistakes.
These aren’t theoretical. They’re the mistakes I see (and have made) repeatedly. The throughline is almost always the same: most options trading mistakes trace back to skipping fundamentals.
1. Ignoring the Greeks
Selling options without understanding delta, theta, gamma, or vega is flying blind.
The most common version: not knowing your probability of assignment (delta) or how time decay actually works (theta).
The result? Surprised by assignment, confused why positions move the way they do, and no framework for making adjustments.
2. No Volatility Check Before Entering a Trade
Selling premium without checking whether IV is elevated relative to HV is like accepting a job without asking about the salary.
High premium can mean you’re fairly compensated for the risk…
…or it can mean the stock is genuinely dangerous and the market is telling you so.
3. Trading Illiquid Options
Wide bid-ask spreads eat into your returns on every single cycle.
Worse, you can’t exit positions when you need to. You’re stuck watching a trade move against you with no clean way out.
The result is death by a thousand cuts. Small spread costs compound into massive drag over a full year of Wheel trading.
4. Skipping Fundamental Analysis
Selecting stocks purely on premium or IV without checking the underlying business is the fastest way to end up owning something you shouldn’t.
The litmus test is simple:
Would I hold 100 shares of this stock for 6-12 months without options?
If the answer is no, the stock doesn’t qualify. Full stop.
5. Poor Position Sizing
Putting too much capital in a single position turns a manageable rotation into a portfolio crisis.
One assignment should never tie up more than 20% of your portfolio.
That’s a hard cap, regardless of conviction.
6. Emotional Trading
The cycle is depressingly predictable:
- You lost a trade
- Angry, you revenge trade to make up the difference (larger size, worse stock)
- This leads to a larger loss
- Then you panic
- Finally, you blow your account
Remember:
Premium is the bait, assignment is the hook.
Discipline breaks compound faster than returns.
One emotional decision can undo months of patient, systematic work.
7. Choosing the Wrong Stocks
Stock selection is 90% of The Wheel.
Meme stocks, speculative biotechs, unprofitable growth names…the premium is high because the risk is high. That’s a warning, not a gift.
No amount of clean options execution saves you from a bad underlying stock. None.
The Throughline
Every one of these mistakes traces back to skipping the concepts covered earlier in this guide.
The Greeks, volatility, liquidity, strike selection…they exist to prevent these exact errors.
Master the fundamentals, and most of these mistakes become significantly harder (but not impossible) to make.
For the full breakdown of each mistake with real examples and prevention strategies, see Common Options Trading Mistakes to Avoid.
Options Fundamentals at a Glance
Here’s a breakdown of every concept in this guide, what it controls, why it matters for The Wheel, including where to go deeper:
| Concept | What It Controls | Why It Matters for The Wheel | Deep-Dive |
|---|---|---|---|
| Options Basics | What options are, how they work | Foundation for every Wheel trade | What Are Stock Options? |
| Strike Price | The price you buy/sell shares at | Determines entry point and probability | Options Contracts |
| Expiration (DTE) | How long the contract lives | Controls theta decay rate and gamma risk | Options Contracts |
| Premium | What you collect (or pay) | Your income, which drives returns | Options Contracts |
| Options Chain | Where you find and evaluate trades | Your primary trade selection interface | How to Read an Options Chain |
| Delta | Price sensitivity + probability proxy | Strike selection, probability of assignment | Understanding Delta |
| Theta | Daily time decay | Your income engine — the reason selling works | Understanding Theta |
| Gamma | Rate of delta change | Risk near expiration — why DTE matters | Options Greeks Explained |
| Vega | IV sensitivity | Position sizing around volatility events | Options Greeks Explained |
| Implied Volatility | Market’s expected movement | Premium levels, trade timing | What Is IV? |
| Historical Volatility | Actual past movement | Reality check on IV, regime detection | What Is HV? |
| IV/HV Gap | Relative volatility pricing | Primary trade filter — overpaid or underpaid? | Using IV and HV to Select Trades |
| Bid-Ask Spread | Transaction cost per trade | Liquidity gate — compounds across annual cycles of The Wheel | Bid-Ask Spreads |
Your Options Fundamentals Learning Path
If you’re ready to go deeper, here’s the recommended reading order. Each article builds on the concepts before it, so try not to jump around.
- What Are Stock Options? A Beginner’s Guide — Start here if options are new to you
- Understanding Options Contracts: Strike, Expiration, Premium — The three building blocks of every contract
- How to Read an Options Chain — Learn to navigate the interface where trades happen
- The Options Greeks Explained — The four forces that move your positions
- Understanding Delta — Strike selection and probability of assignment
- Understanding Theta — Time decay and the income engine
- What Is Implied Volatility (IV)? — The market’s forecast of movement
- What Is Historical Volatility (HV)? — The reality check on IV
- IV and HV: Using Volatility to Select Better Wheel Trades — The trade filter that ensures to get paid fairly for the risks you take
- Understanding Bid-Ask Spreads and Options Liquidity — The hidden cost that compounds
- Common Options Trading Mistakes — What NOT to do (and why)
You don’t have to read them all in one sitting.
But by the time you’ve worked through this sequence, you’ll have a stronger options foundation than most Wheel traders ever build.
The Foundation Beneath the Strategy
The Wheel Strategy is mechanically simple. Sell puts, collect premium, get assigned, sell calls, collect more premium, get called away, repeat.
But executing it well requires understanding the options fundamentals beneath it.
This guide covered the complete foundation:
- What options are and how contracts work
- How to read an options chain
- The Greeks that move your positions
- The volatility that prices them
- The liquidity that costs you
- The mistakes that punish you
Here’s the hierarchy that matters:
Stock selection > Fundamentals > Mechanics.
The mechanics are learnable in a day.
The fundamentals take weeks to internalize.
Stock selection takes months to years to master.
But you can’t do any of them well without the layer underneath.